What Does xG Mean in Football? Expected Goals Explained Simply
You’re watching a match. The commentator says something about a team’s “xG” and a graphic flashes on screen showing two decimal-point numbers. Someone on social media posts that a side “deserved to win based on their expected goals.” Your friend nods knowingly. You nod along. But what does xG actually mean, and should you be paying attention to it?
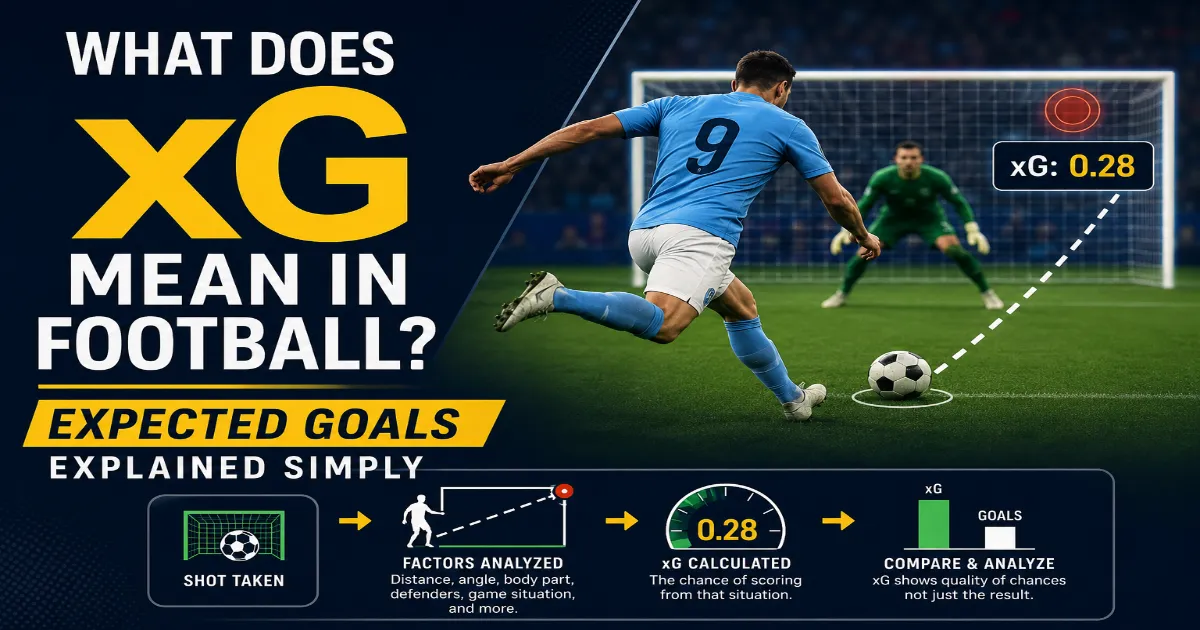
The short version: xG, short for expected goals, is a number that tells you how likely a given shot was to end up in the net, based on where it came from and how it was taken. The longer version is worth understanding properly, because once you get it, you start watching football differently — and the numbers start telling stories that the scoreline sometimes doesn’t.
Start With the Problem xG Was Built to Solve
Football has always had a scoreline. For most of the sport’s history, that scoreline was treated as the complete and final verdict on any match. The team that scored more goals won. End of story. But anyone who has watched football seriously for more than a few seasons knows that scorelines regularly lie. A team can completely dominate a match — more possession, more shots, more time in the attacking third, more clear-cut chances — and still lose because the opposing goalkeeper made three extraordinary saves, or because their striker’s clinical finish from an almost impossible angle turned a low-probability attempt into a goal that changed the result.
The problem is that the traditional match statistics — shots, shots on target, corners, possession percentage — couldn’t capture the quality of what happened in those moments. Eleven shots isn’t eleven shots; a long-range speculative effort from thirty-five meters out and a clean one-on-one with the goalkeeper from eight meters out both count as one shot in the box score, but they are utterly different propositions in terms of how often they produce goals. Expected goals was built specifically to solve this problem, by attaching a probability value to each shot that reflects how likely that specific shot, from that specific location, in those specific circumstances, was to end up in the back of the net.
How xG Is Actually Calculated
The foundation of any xG model is a large database of historical shots — typically hundreds of thousands of them — with the result of each shot recorded alongside a series of variables describing the circumstances in which it was taken. Those variables typically include the distance from goal, the angle to goal from where the ball was struck, whether the shot was taken with the foot or the head, whether it followed a cross or a through ball, whether the player was under pressure from a defender or had time and space, and whether it came from open play, a set piece, or a counterattack.
Once you have that database, you can calculate, for every type of shot, how frequently that kind of attempt resulted in a goal historically. A shot from directly in front of goal, eight meters out, on the dominant foot, with no immediate defensive pressure, might have resulted in a goal roughly sixty percent of the time across your historical dataset. That shot, then, gets assigned an xG value of approximately 0.60 — meaning it represents about six-tenths of an expected goal. A speculative effort from thirty meters out, taken under pressure with the weaker foot, might convert historically at around two percent of the time, giving it an xG value of 0.02.
Add up the xG values of all shots a team takes across a match and you get their total expected goals for that game — a number that tells you, based purely on the shots they created, how many goals a typical team would have scored from those opportunities. Do the same for the opposition and you have a full picture of who actually created the more dangerous football, regardless of what the final scoreline says.
A Concrete Example That Makes It Click
Imagine a match that ends 1-0. Team A scores from their only shot — a tap-in from two meters out after a goalkeeping error, which had an xG value of 0.90. Team B had eight shots but most of them were long-range efforts that rarely go in, giving them a combined xG of 0.4. The score says Team A controlled the match. The xG says Team A got a high-probability goal and a clean sheet while the opposition never genuinely threatened, despite the eight shots. In this case, the scoreline and the xG tell the same story.
Now change the scenario. Team A scores from a twenty-five-meter screamer with an xG of 0.06 — that kind of goal goes in about once every seventeen attempts at that range. Team B had a one-on-one, a tap-in from the penalty spot that was missed, and three clear headers, with a combined xG of 2.8. The score still says 1-0 to Team A. But the xG is telling you that Team B created enough high-quality chances to score nearly three goals, while Team A scored once from a shot type that historically converts less than one in fifteen times. Who actually played better football? The xG says Team B — and if these teams play ten more times from these respective positions, Team B will very likely win most of them.
That’s precisely the kind of context xG was designed to provide. It doesn’t change the result. It helps explain how likely or unlikely that result was, and how sustainable the underlying performance is.
Why Broadcasters and Analysts Started Using It
xG began as an internal tool for football analytics departments, used by clubs to evaluate their own attacking and defensive efficiency relative to the chances they were creating and conceding. Its earliest public adoption came through statistically-minded football writing, particularly from analysts like Ted Knutson and companies like StatsBomb, who helped develop and popularize more sophisticated xG models in the 2010s. From there it filtered into football journalism, gradually appearing in newspaper match reports and online analysis pieces before the major broadcasters picked it up.
In the Premier League, xG became a regular graphic on Amazon Prime’s match coverage around 2019, then filtered across to Sky Sports and eventually the BBC’s Match of the Day highlights programme. That last transition — from specialist analytics tool to Saturday-evening mainstream TV graphic — was the moment most casual football fans first encountered the metric, though often without the context needed to understand what the number actually meant.
The Limitations — and There Are Real Ones
xG is genuinely useful, but treating it as a definitive verdict on any match is a mistake, and it’s worth being clear about why. The most fundamental limitation is that xG models are built on historical averages, which means they tell you what a shot of this type has done historically, not what this specific player will do with it in this specific moment. Mohamed Salah in his prime, one-on-one with a goalkeeper at eight meters out, is not operating at the historical average conversion rate for shots from that position. He is operating significantly above it. An xG model that doesn’t account for individual finishing skill will systematically underrate the expected output of elite finishers and overrate the expected output of poor ones.
Different providers also calculate xG differently, which is why you’ll sometimes see slightly different numbers from Opta, StatsBomb, and Understat for the same match. The core methodology is similar across providers, but the variables included and the historical datasets used vary enough to produce meaningfully different outputs in some cases, which can be confusing when two reputable sources appear to contradict each other.
There’s also the question of what xG deliberately leaves out. It doesn’t account for goalkeeper positioning or quality — a shot that would have gone in against an average goalkeeper might be saved comfortably by a world-class one, but both generate the same xG value. Some more advanced models have begun to incorporate goalkeeper quality as a variable, but the basic xG figure you see on a broadcast doesn’t include it.
How to Actually Use xG Sensibly
The most useful way to approach xG isn’t as a verdict on individual matches but as a pattern-spotter across larger samples of data. One match where a team significantly outperforms or underperforms their xG could simply be variance — goalkeepers have exceptional nights, strikers miss chances they’d normally score from. But a team that consistently underperforms their xG over fifteen or twenty matches has a finishing efficiency problem worth taking seriously. A team that consistently concedes fewer goals than their defensive xG suggests is probably benefiting from excellent goalkeeping or outstanding shot-blocking, either of which should inform how you evaluate their defensive record.
This longer-view application is where expected goals has genuinely changed how analysts, journalists, and increasingly fans talk about football. It created a common language for “this team deserves more than they’re getting from results” or “this team’s results are better than their underlying performance suggests,” conversations that were always happening informally but now have a number attached to them.
Why It Matters More Than You Might Think
The reason xG has moved from niche analytics tool to mainstream broadcasting graphic in under a decade is that it captures something football fans have always instinctively understood — that results aren’t always fair representations of what happened during a match — and gives that feeling a number. It doesn’t replace watching the game, and it doesn’t make the final score any less the final score. But in a sport where context matters enormously and where “we were the better team” has historically been either unprovable or just shouting into the void, expected goals gives that feeling something solid to stand on.VAR in Football Explained: How It Works, Why It Divides Fans and What’s New at World Cup 2026
Once you start seeing shots in terms of their probability rather than just their quantity, you start noticing things about football you might previously have missed. Why a goalkeeper making one save can matter more than another making six. Why some teams seem to consistently “punch above their weight” in results and others consistently disappoint despite looking dangerous. Why a missed penalty isn’t just a bad moment but a statistically expensive one, since even the best spot-kicks carry an xG of only around 0.76 rather than the automatic goal they’re often treated as. The number itself is a tool. What you build with it depends on how closely you’re paying attention.
▪️▪️ Follow us on Facebook ▪️▪️